top of page


This week, I worked on turning a still image by professor Bosch into an animation. The main result is above, with rainbow and grayscale variants below. I like the pure black image the most, but the others I think do a good job at helping the viewer follow the line.


To create this, I used the file that professor Bosch provided with the ordering of the traversal. I used a simple python script to turn the file into a list of x y coordinate pairs.
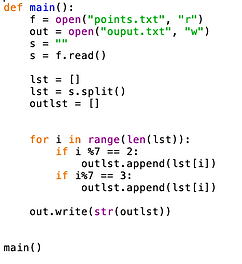
Since I am a beginner at p5js, I simply copy and pasted the output file into a p5js project, and used it to draw the lines. I drew a line between the previous point and the current point, plus extras at the beginning and end. For the color variation, I used similar methods to last week with a sine function.


bottom of page